
1.1 Overview
The Internet of Things, which is a significant part of the progress and extension of the Internet, means to transmit information between the different embedded system in various devices to reduce human exertions. It grows up incredibly from a basic concept to widely used in the world nowadays within two decades.
In order to build up one node of a large IoT system, there are three things are important and need to be involved, which are boards, sensors and the transmission information between them.
Therefore, the aim for this project, which is conducted by MPI and UCLA, is to learn the knowledge about different boards and sensors to make them work correctly, get correct data and write script to generate information from the data to create a multifunctional environment detector.
1.2 Tools
Boards: Raspberry PI Zero W, Udoo Neo
Sensors: Lepton 2.5, PMS7003, GY-BME280, GY-GPSV3-NEO M280
Operating Systems: Windows, UDOObuntu Linux
2. Devices

2.1 Boards
2.1.1 Raspberry Pi Zero W
Raspberry Pi is a series of well-known single-board computers. And Raspberry Pi Zero W, which was used in the project, is smaller and require less power than others. It has his official operating system, NOOBS, and RASPBIAN. Also, it supports Wi-Fi, Bluetooth 4.1 and Bluetooth Low Energy. Pi Zero only has 512MB RAM, which is quite small for processing image. And that is the reason the board had been changed to Udoo NEO.
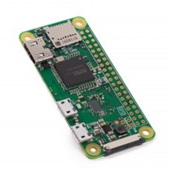
Figure 1. Raspberry Pi Zero W
2.1.2 Udoo NEO
Udoo NEO is an all-in-one open hardware for Android and Linux. And for the operating system, it can run both Android Lollipop and UDOObuntu 2, which is an Ubuntu-based Linux and we used. It embedded Wi-Fi and Bluetooth 4.0 module and could be easily accessed by Arduino IDE.

Figure 2. Different models of Udoo NEO
There are three models of Udoo NEO, and Full Udoo NEO was used, which contains 1G RAM, to make it powerful than the Raspberry PI zero W. The Udoo NEO board was linked to a large board to get more pins to connect multiple sensors together.
2.2 Sensors
2.2.1 PMS7003
PMS7003 was connected to the Udoo NEO, flared by Arduino IDE and viewed the result by Putty in this project.
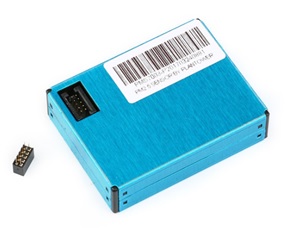
Figure 3. PMS7003
The Plantower PMS7003 is a dust detect sensor which calculates the particles in the air by obtaining the curve of scattering laser change with time. The sensor would get various types of particles like PM1, PM2.5, and PM10. What's more, the sensor could calculate the number of particles within a certain diameter beyond the sensor in 0.1 L of air.
2.2.2 GY-BME280
GY-BME280 is a high precision pressure, temperature and humidity device. These modules are settled on the back of this small board and could work in various environment and weathers.
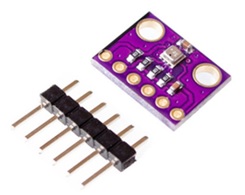
Figure 4. GY-BME280
2.2.3 GY-GPSV3-NEO M8N
GY-GPSV3-NEO M8N is a device designed to receive and track the satellite signal by the Global Positioning System (GPS) and the signal from both GLONASS and BeiDou could be received and processed.
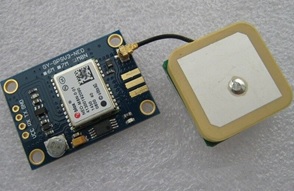
Figure 5. GY-GPSV3-NEO M8N (with antenna)
However, the antenna must be settled outside of the window in order to get the satellite signal.
3. Implementation

As mentioned above, different boards and sensors have different approaches to set and control them properly. In this report, the implementation of Udoo NEO connect with PMS7003 would be explained as an instance.
3.1 Set up Udoo NEO to laptop
Flashing UDOObuntu to the Udoo NEO is quite easy, which has text and video tutorial on the official website, and the approach is quite similar to flashing image to Raspberry. After flashing UDOObuntu to the SD card and linked Udoo NEO to the laptop, it is the time to make the computer recognize the device already the plugin. This step is a hidden step if someone is following the tutorial. It was serious because he might not understand which part goes wrong in his work and even does not know what is the keyword to search and find the solution.
In Device Manager, choose other device and there is a device called RNDIS. Right-click it and choose Update Driver Software.
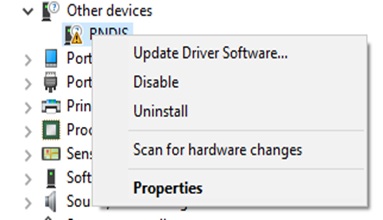
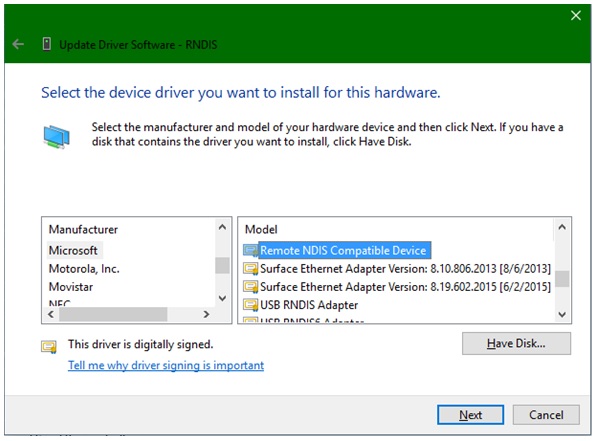
After that, choose to Browse my computer for driver software, pick the list, and choose network adapters.
In the Manufacturer, select Microsoft and Remote NDIS Compatible Device model. Finally, the device is connected to the laptop by USB cable.
3.2 Understanding the transport protocol
PMS7003 would measure the curves' change of scattering laser, calculate, and separate the result into the density of PM1, PM2.5, and PM10. The information would be packaged into a 32 Bytes frame and then send to the board. According to the transport protocol-Active Mode(Figure x), the density of the standard particle is recorded from the seventh to the twelfth bytes.
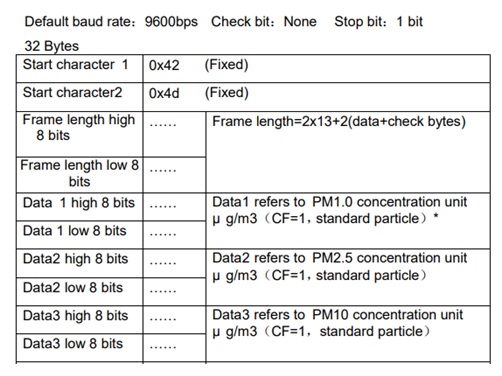
PMS7003 transport protocol-Active Mode
The whole frame could be shown in Bytes by minicom. The command is "sudo minicom -b 9600 /dev/ttymxc5".
Some sensors are used so common that in Arduino IDE, there are some scripts already written in it. Also, most of the sensors have its own script on GitHub.
3.3 Understand and write a script to show information
The script we had found for PMS7003 is quite obvious to understand.
Firstly, in setup(), which is the setting before the board is running, check the Serial is working, set the timeout and turn on the sensor.
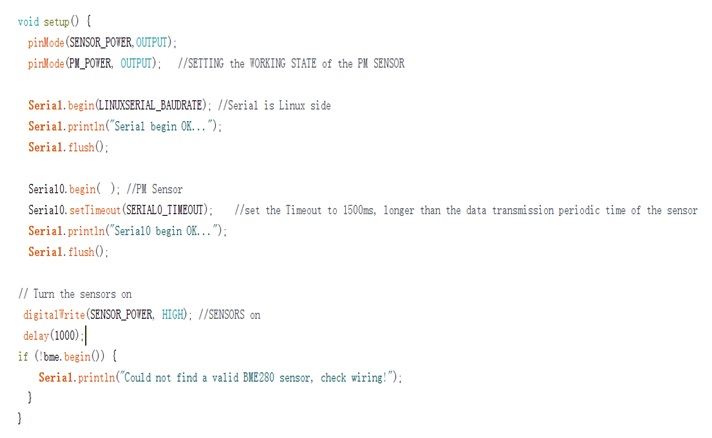
The function myReadPM() is in the loop() which means it would run continuously.
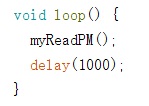
In myReadPM(), LED would turn on first, stands for the particle detecting is started. Then do a warm up. Clean up three values and then start to read the PM value by calling readPM() function. Finally, turn off the LED as function closed, calculate the average and print it out.

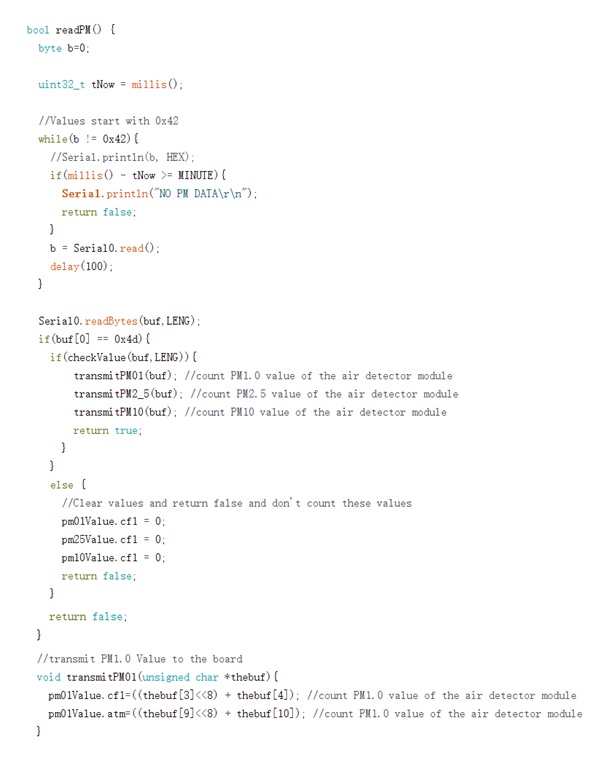
For readPM() function, it would check the first four bytes are correctly read and use transmitPM01(), transmitPM2_5(), and transmitPM10 to divide and save a whole serial into three variables as the value of the density of three kinds of particles.
4. Result

All sensors were put in one Udoo NEO board with the extending board after all of their scripts were implemented. Then, the board was settled near a window and put the GPS antenna outside of that window.
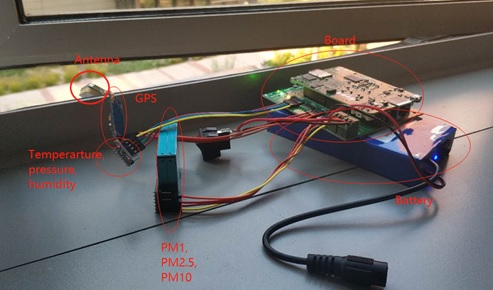
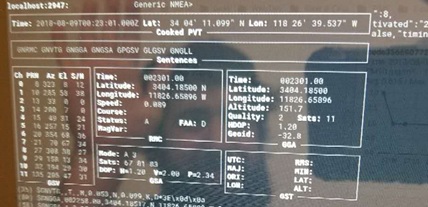
The result was shown in the command line of the board. And by using the SSH connection between the board and laptop, the result is shown on the screen.
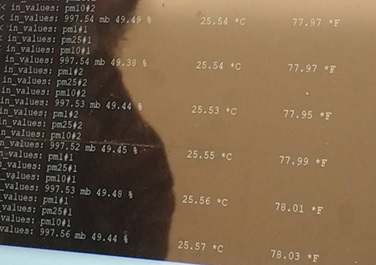
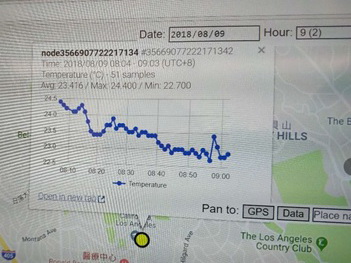
Furthermore, the data which had been collected by this device would be transmitted to canarin.net. It is a website written by the adviser and his friends. It would use google map and determine the position of all the devices as a small circle. Also, the user could view the other information like temperature by click on the circle. It would general a diagram of each data and calculate the average value after a period of time.
5. Experience

The UCLA project in this year is an innovative year, which had divided six people into three groups and our group was work with foreign advisers. That was an invaluable opportunity to have the experience discuss and work with them, who gave us countless help in setting up and implementation.
Connecting and set up a sensor to a board sounds like an easy job but not. Different boards have their own IDEs and own languages, even need a specific service area to make them work successfully. For different devices, have their own pins, libraries, and functions. Also, there are some devices should be soldered with pins by self. It must be understood completely and correctly on both the hardware and software part; therefore, the main part of the time we spend is on searching the document of these boards and sensors. The problem that there is nowhere to find the same problem or the approach of debugging does not work would always be encountered. Fortunately, with the help of our adviser, we solved the problem that confused us for several days.
In conclusion, we are very grateful to have the opportunity to participate in the exchange program with UCLA. It is not only a remarkable but also a priceless experience to work amid people from various countries and cultures. The precious technical knowledge and the skill we have gained related to the Internet of things through the program will make an eternal advantage for us in the future.