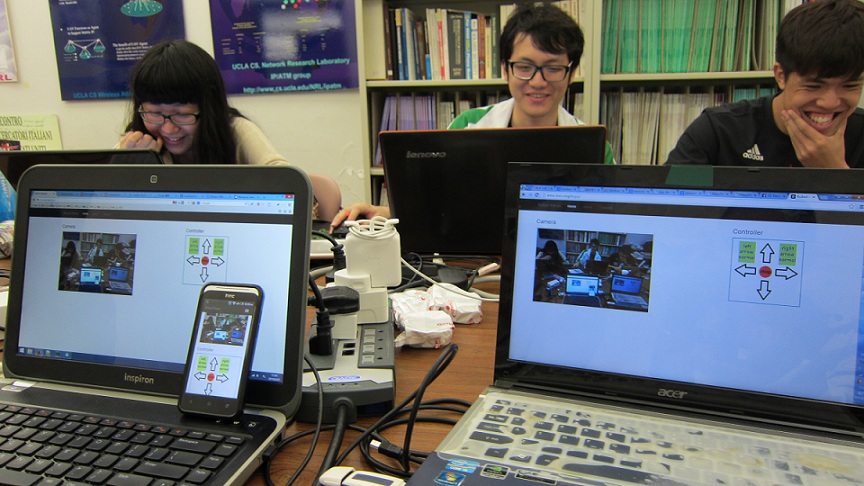
1.1 Overview:
We were joining a summer exchange student program in ubiquitous computing which is held by MPI and UCLA. We evaluated the sentiment of users by analyzing the tweets collected by MPI in two year. Firstly, some of the tweets posted by the Weibo users within two years are filtered out as row dataset, and then three programs written by java are used to check the content of the tweet with the sentimental dictionary and calculate the score which implies the sentiment of users. Then intuitive graphs based on the program result are generated. Secondly, we developed a web application to do the visualization of the result. Finally, when we open the web page, we could see the distribution of positive and negative sentiment on the map of Macau.1.2. Sentiment Word Dictionary:
One of the elementary parts of this project is to edit a comprehensive and authoritative Sentimental Word Dictionary. We found two pre-existing emotional dictionaries in the internet, one is《台湾大学极性情感词典》,the other one is 《知网情感词典》 both of which are authoritative. We downloaded these two emotional dictionaries and emerged them into one sentiment word dictionary with other popular default icons added. Then we used Ruby language to write a program to divide the whole dictionary into two sub-dictionaries, one is positive dictionary, the other one is negative dictionary.2.1 Program to calculate user’s sentiment score of each week:
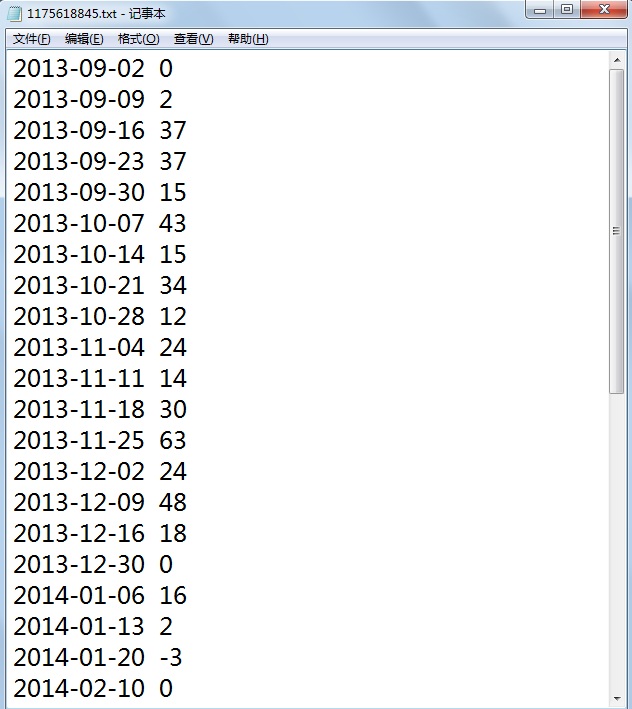
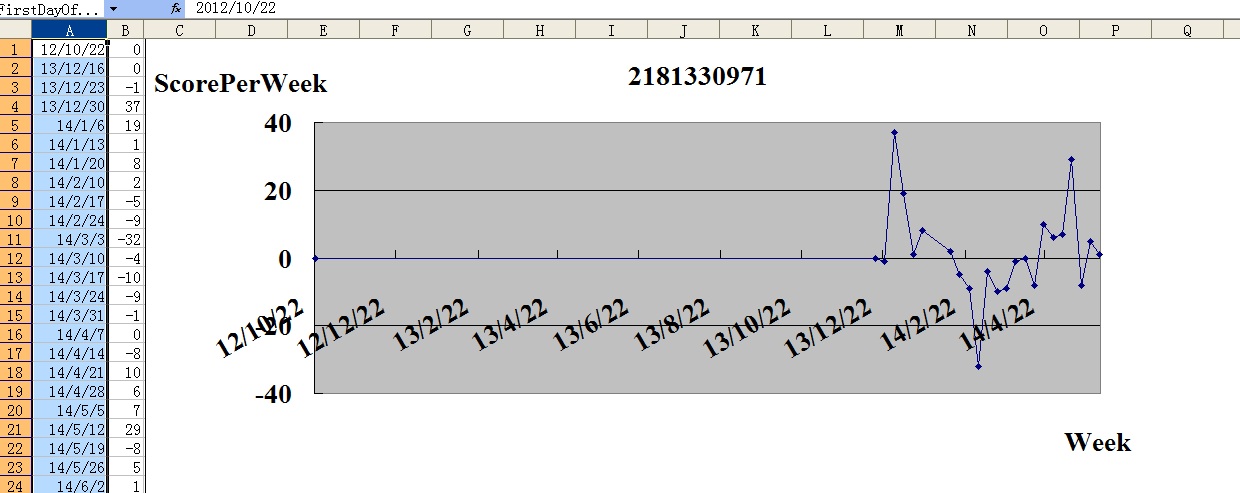
This program generates 131 txt files and each of which includes each user’s sentiment score of each week in the two years. The first column is the first day of the week and the second column is the score of that week. The score of each week is measured by making a difference between the accumulated positive score and the accumulated negative score.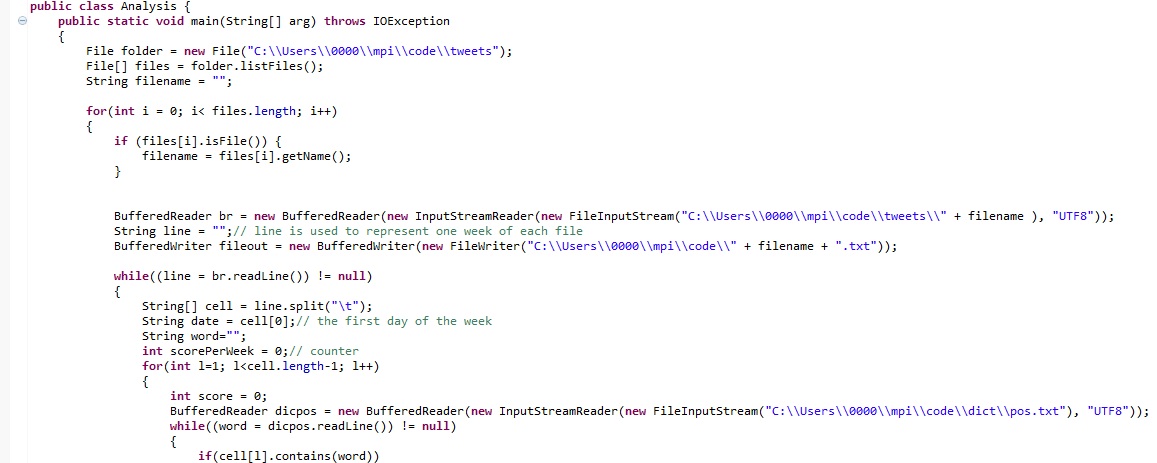
2.2 Program to evaluate user’s sentiment:
A program provides an auxiliary method for users to test their personalities. It will prompt the user to enter the user id in the dialog box, and then output the personality result in the console by executing the evaluate Personality () method. Show the result example: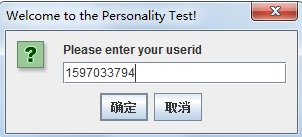

2.3. Program to transfer TXT file to JSON file:
This program is to change the txt file into Json file with includes date, text, userid, location and score. The location (latitude, longitude) is used to match the location on the Google map and show the distribution of the sentiment of users.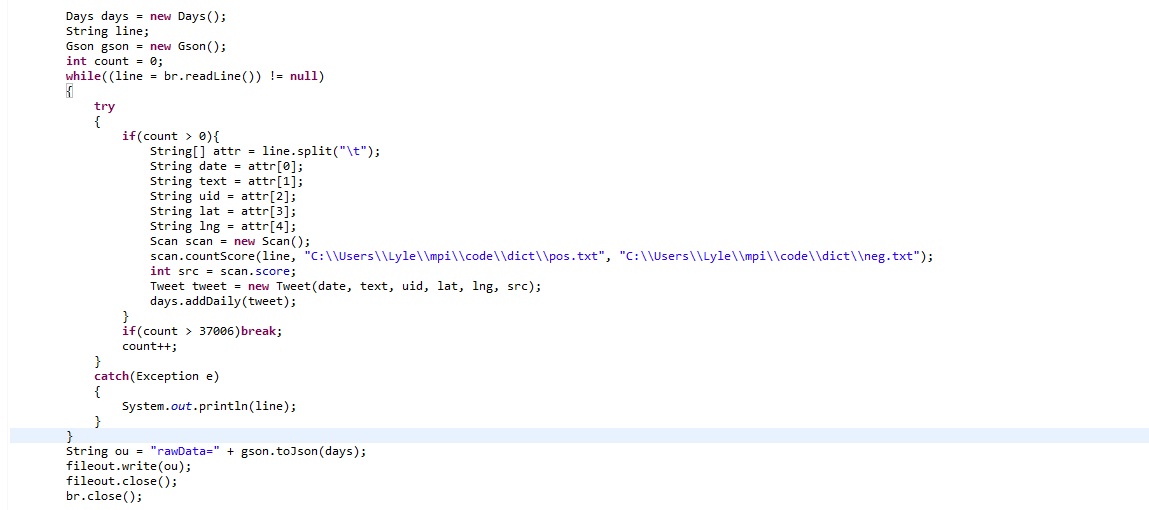
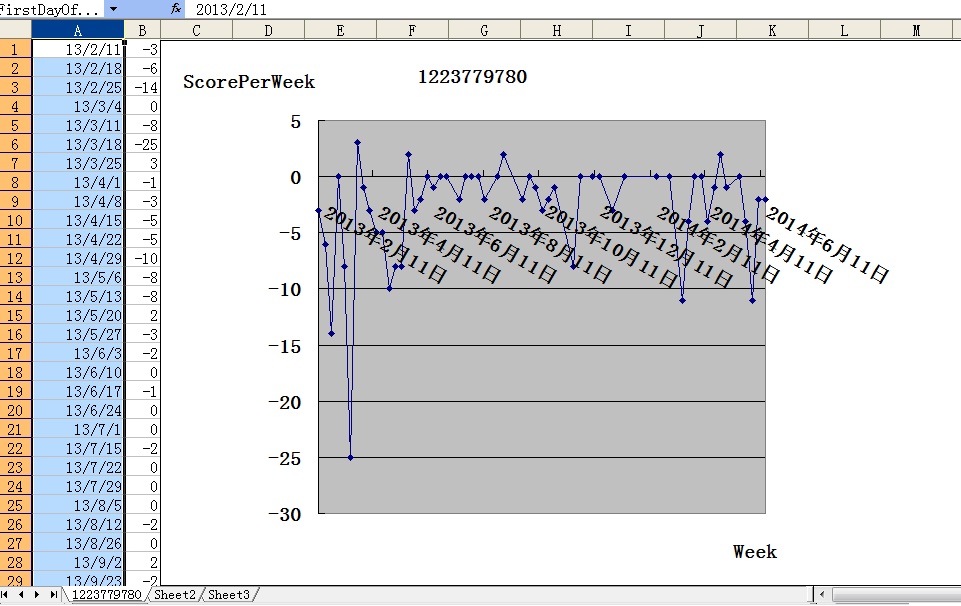
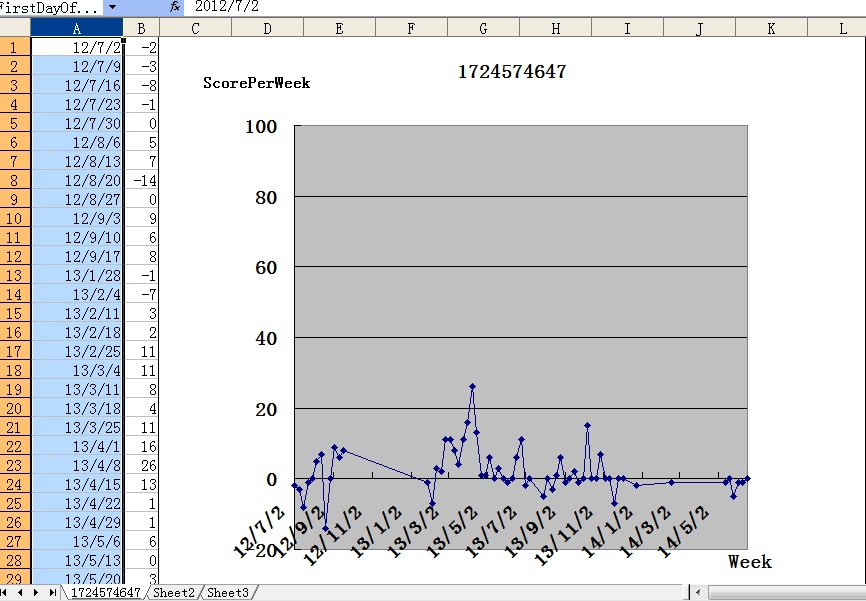
3.1 Line chart:
We extracted four typical users’ data to generate the line charts which represent most of the user types in our dataset. Type one: Optimistic person who is happy for most of time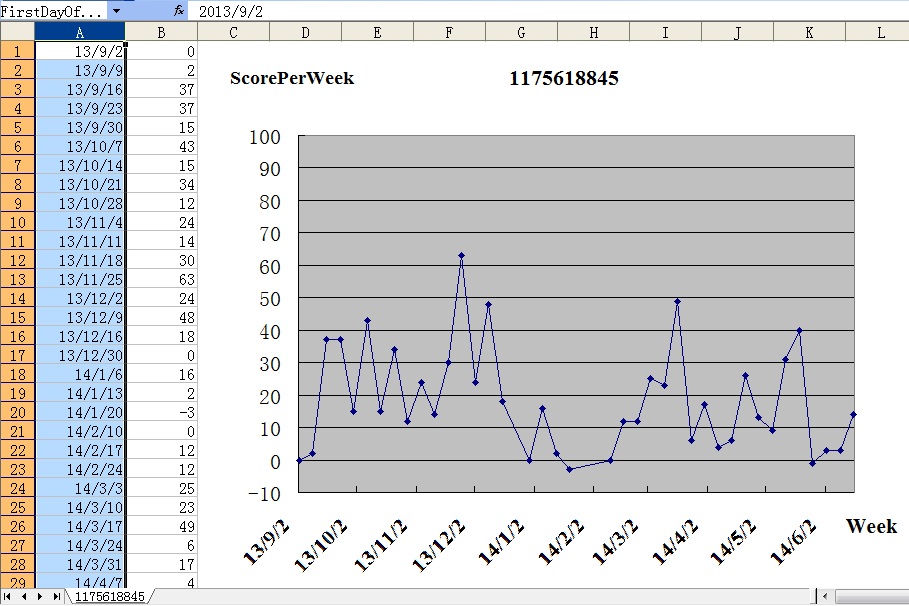
3.2. Distributive map:
A web page which embedded a Google map showing the sentiment distribution of Weibo users in Macau was built based on the preceding programs. We created an html page and embed a Google map into the page. By executing some basic functions, users can see the sentiment distribution on the map in different ways. (You can specify one day, and see the happiness or sadness in different locations.) Here is our web address: http://llv.sorz.org/web/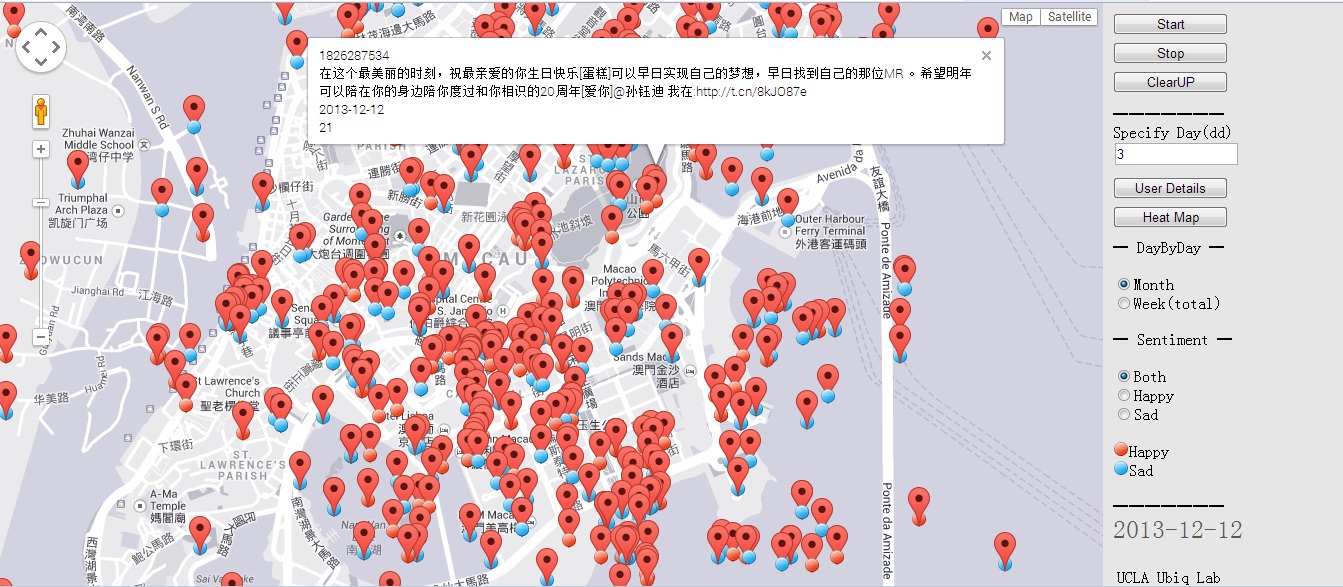
3.3. Function keys:
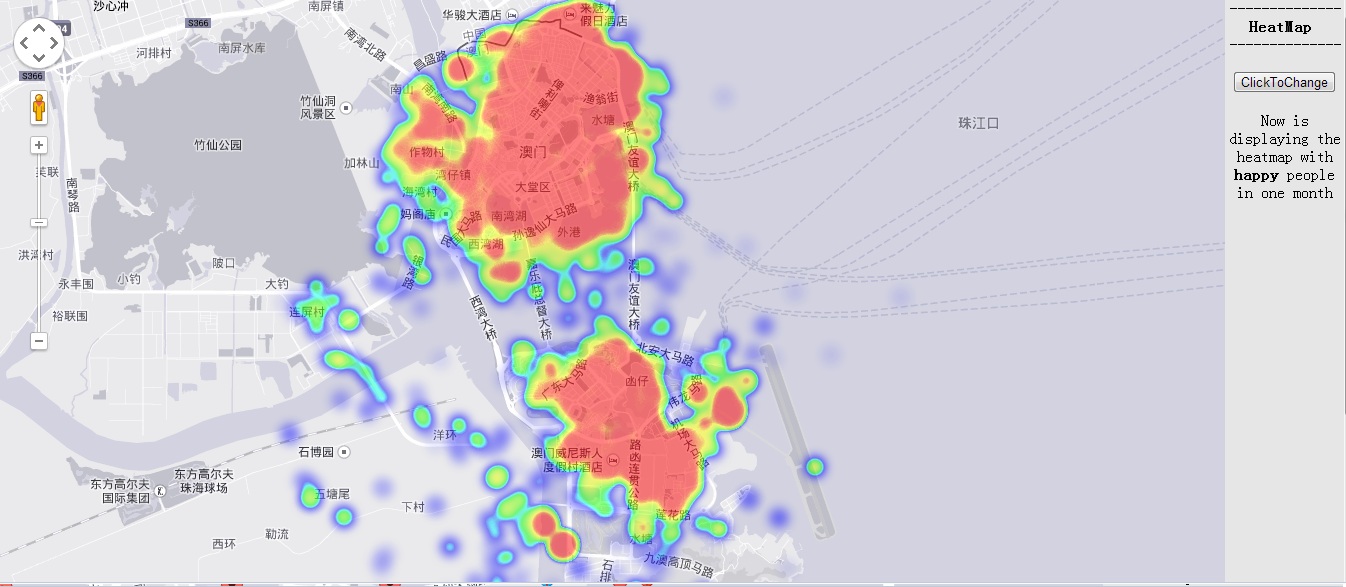
Start: If this button is pressed, the sentiment distribution of users in one day will be displayed at a rate of one second; Stop: If this button is pressed, the sentiment distribution in the web page will be stopped immediately; ClearUp: If this button is pressed, the sentiment distribution on the page will be gone entirely; Heat Map: If this button is pressed, it will redirect you to a heat map which shows another presentation of the sentiment distribution; User Details: Before this button is pressed, you should enter a day in the box under the “specify day” .Then the detail information about the user will be displayed over the spot you selected.
In this week, we have already completed our project in ubiquitous computing. During that period of time, we have learnt how a project was conducted and each member of our group gave full play to our strengths and mitigated our weaknesses. Though encountering some problems in the process of implementation, we optimized our project progressively and overcame the difficulties successfully in the end. Apart from working, we also had a taste of the local culture of LA. In conclusion, it is really a precious experience for us to participate in such a meaningful exchange program.